

Loneliness & friendship in America
This research explored the topic of loneliness and friendship with 2,025 United States residents. Adapting a loneliness scale originally developed by Hughes et al. (2004), we used exploratory factor analysis and k-means clustering to identify three loneliness subgroups: Highly Lonely (30 per cent of Americans), Moderately Lonely (31 per cent of Americans), and Least Lonely (39 per cent of Americans).

Among those Americans in the Highly Lonely subgroup 90 per cent reported they often felt like they lacked companionship, 90 per cent often felt left out by other people, and 90 per cent often felt isolated from other people. From a demographic perspective, those in the Highly Lonely subgroup were more likely to be under the age of 45 and hold liberal political views.
In contrast, among those Americans in the Least Lonely subgroup only 1 per cent often felt like they lacked companionship and none of them reported feeling left out by or isolated from other people. From a demographic perspective, those in the Least Lonely subgroup were more likely to be over the age of 60 and have an annual household income of over 100,000 dollars.
Number of Close Friends in America
In order to assess the validity of these three loneliness subgroups we also explored their level of friendship and how many people they considered to be their close friends.

On average, those in the Highly Lonely subgroup reported having only 3.39 close friends, those in the Moderately Lonely subgroup reported having 4.03 close friends, and those in the Least Lonely subgroup reported having 5.40 close friends. Put differently, those in the Highly Lonely subgroup reported having 22 per cent fewer close friends than the average American and 37 per cent fewer close friends than those in the Least Lonely subgroup.
Loneliness & Friendship in Canada
This research explored the topic of loneliness and friendship with 1,009 Canadian residents. Adapting a loneliness scale originally developed by Hughes et al. (2004), we used exploratory factor analysis and k-means clustering to identify three loneliness subgroups: Highly Lonely (29 per cent of Canadians), Moderately Lonely (35 per cent of Canadians), and Least Lonely (36 per cent of Canadians).
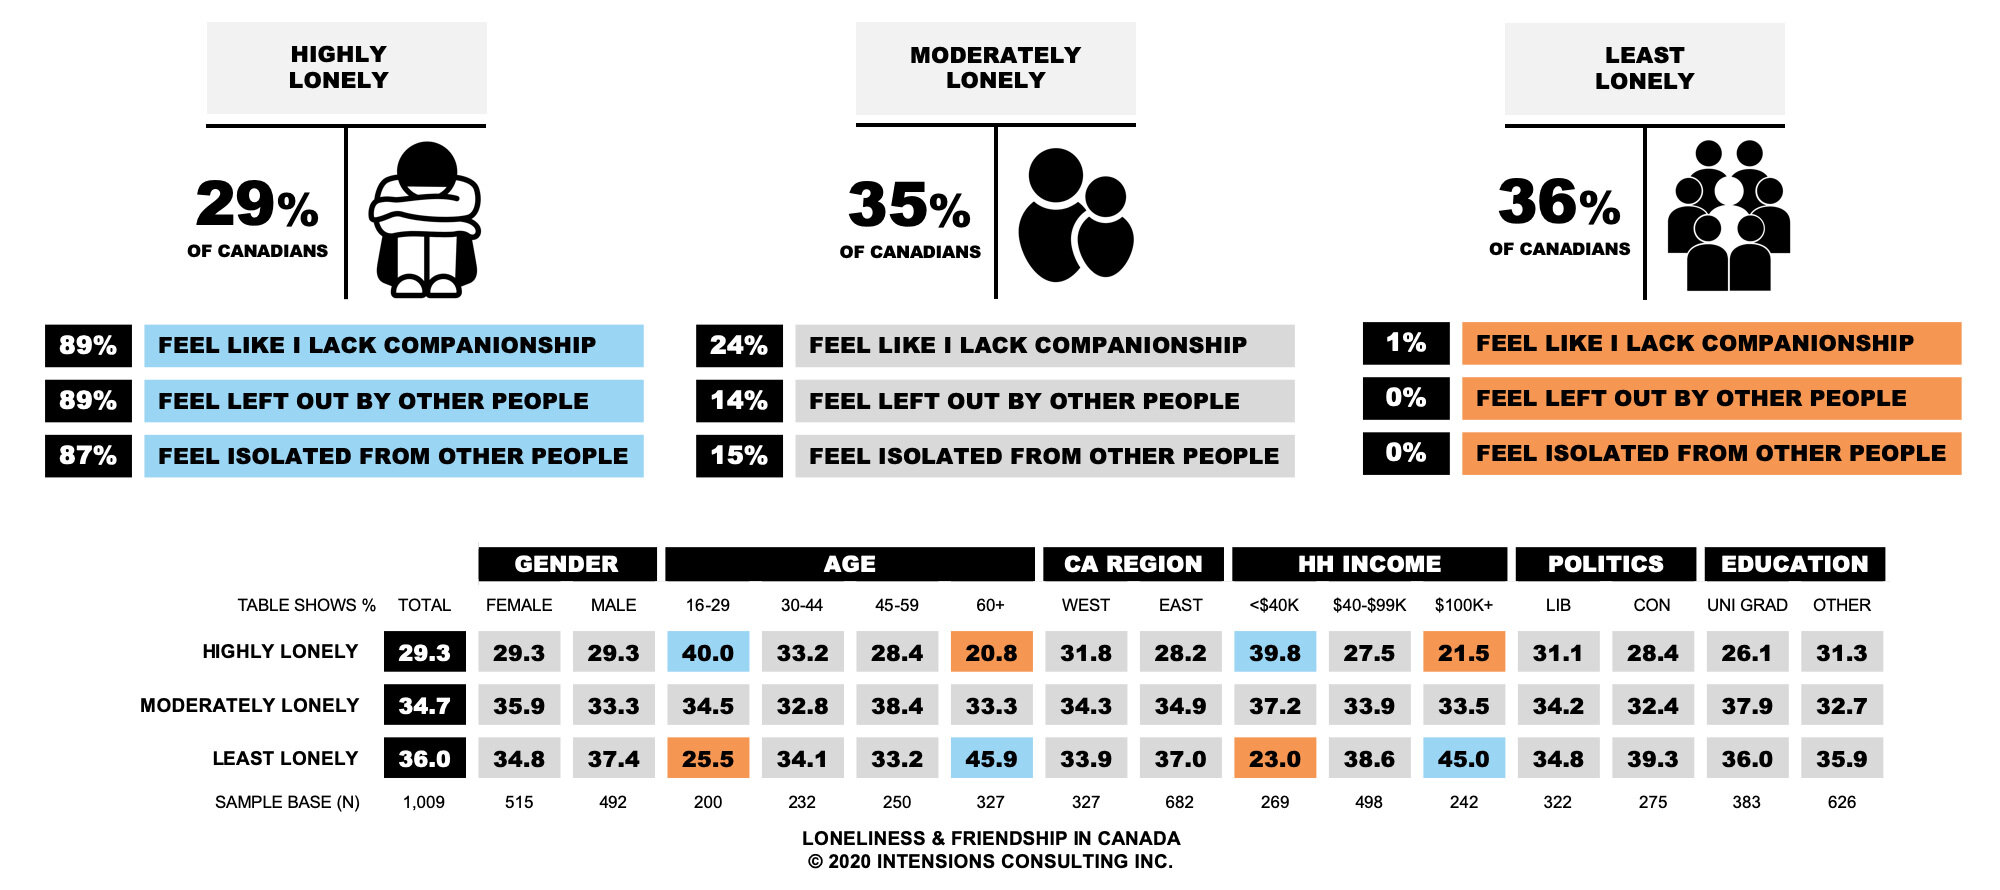
Among those Canadians in the Highly Lonely subgroup 89 per cent reported they often felt like they lacked companionship, 89 per cent often felt left out by other people, and 87 per cent often felt isolated from other people. From a demographic perspective, those in the Highly Lonely subgroup were more likely to be between the ages of 16 and 29 and have an annual household income of under 40,000 dollars.
In contrast, among those Canadians in the Least Lonely subgroup only 1 per cent often felt like they lacked companionship and none of them reported feeling left out by or isolated from other people. From a demographic perspective, those in the Least Lonely subgroup were more likely to be over the age of 60 and have an annual household income of over 100,000 dollars.
Number of Close Friends in Canada
In order to assess the validity of these three loneliness subgroups we also explored their level of friendship and how many people they considered to be their close friends.

On average, those in the Highly Lonely subgroup reported having only 3.22 close friends, those in the Moderately Lonely subgroup reported having 4.25 close friends, and those in the Least Lonely subgroup reported having 5.38 close friends. Put differently, those in the Highly Lonely subgroup reported having 26 per cent fewer close friends than the average Canadian and 40 per cent fewer close friends than those in the Least Lonely subgroup.
ABOUT THis RESEARCH
These are findings from an Intensions Consulting study conducted between January 20, 2020, and January 28, 2020. For this study a 20-minute online survey was administered with a sample of 2,025 United States residents, and 1,009 Canadian residents, aged 16 years and older. Each national sample was stratified by gender, age, and region, to ensure that the sample’s composition reflected the underlying distribution of the population as determined by Census data. For the United States, a traditional probability sample of comparable size would have produced results considered accurate to within plus or minus 2.2 percentage points, 19 times out of 20. For Canada, a traditional probability sample of comparable size would have produced results considered accurate to within plus or minus 3.1 percentage points, 19 times out of 20.
For more information on this research, please contact: info@intensions.co
References
- Hughes, M. E., Waite, L. J., Hawkley, L. C., Cacioppo, J T. (2004). A Short Scale for Measuring Loneliness in Large Surveys: Results From Two Population-Based Studies. Research on Aging, 26(6), 655-672. DOI: 10.1177/0164027504268574