

POPULAR DIETS IN AMERICA
This research explored the topic of popular diets with 2,025 United States residents. For this research, respondents completed a self-report questionnaire that included questions about the diets or eating styles they follow.
This research identified that over 1 in 5 Americans (21%) follow at least one popular diet, with these diets including: Organic Eating (8%), Clean Eating (7%), Gluten-Free (7%), Keto (5%), and Paleo (3%). From a demographic perspective, Americans who follow any of these popular diets were more likely to be under the age of 45, and also more likely to report using Instagram and/or Twitter on a daily basis.

In order to determine which of these factors are most predictive of following any of these popular diets, a binary logistic regression analysis was conducted. The percentages shown in this model reflect converted Odds Ratios modified to calculate Risk Differences (Zhang & Yu, 1998). Cells with statistically significant results are coloured (p < 0.05).
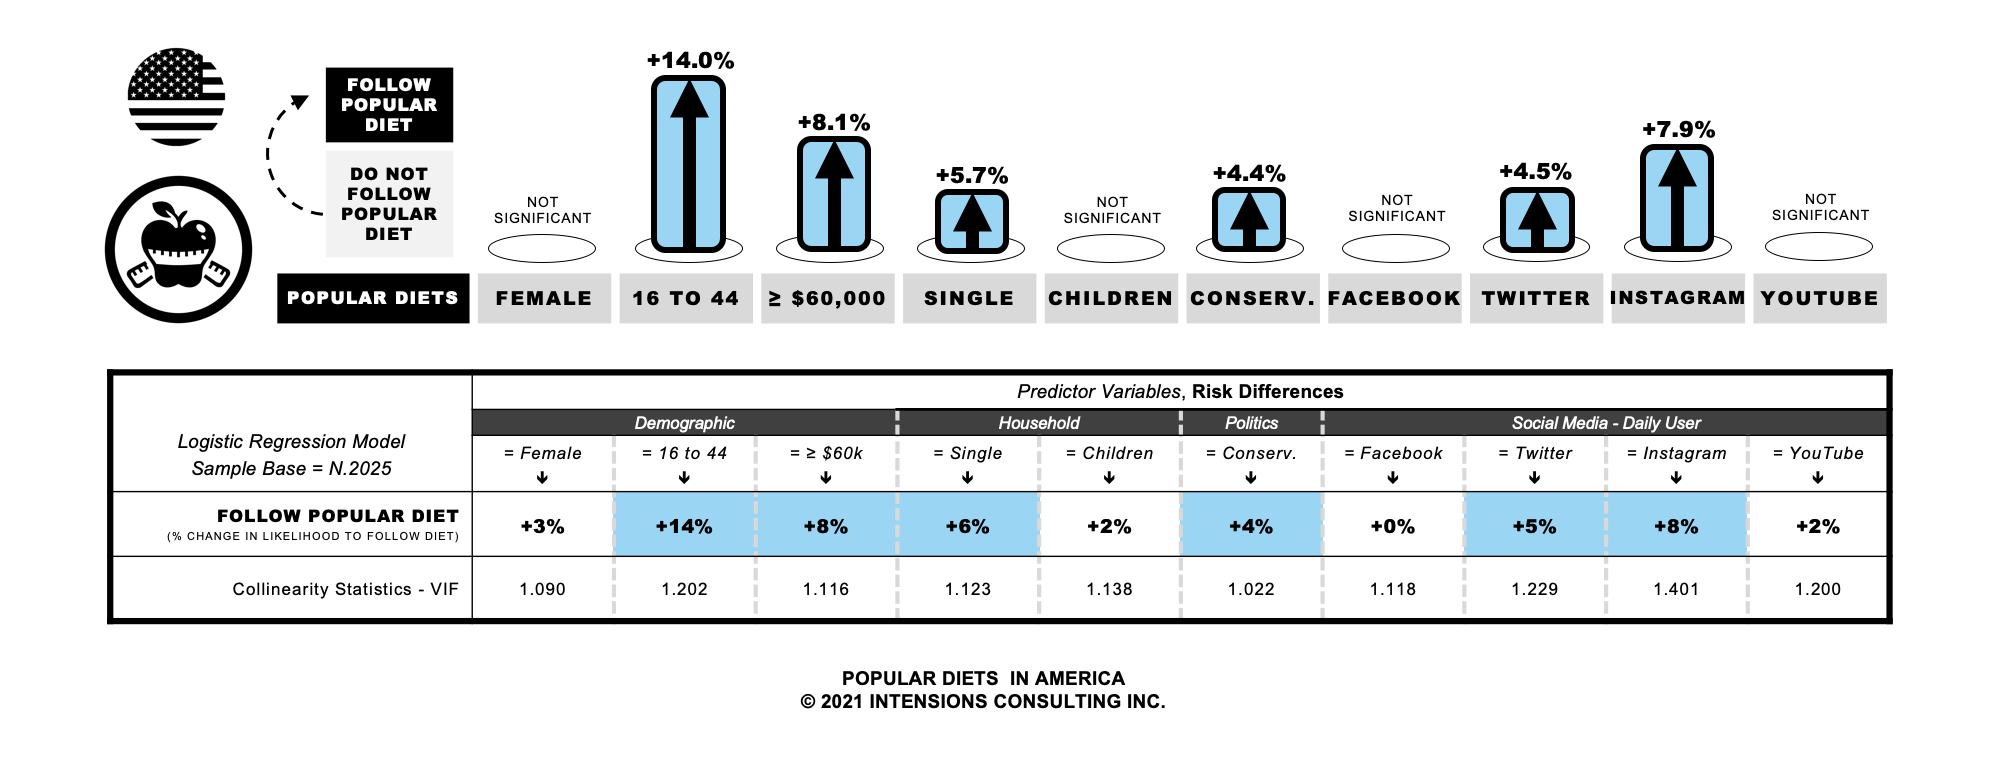
The regression model shows that Americans under the age of 45, those with an annual household income above $60,000, those who live alone, and those who hold more conservative political beliefs are significantly more likely to follow any of the popular diets (+14%, +8%, +6%, and +4%, respectively). The regression model also shows that Americans who use Instagram and/or Twitter on a daily basis are significantly more likely to follow any of the popular diets (+8% and +5%, respectively).
ABOUT THIS RESEARCH
These are findings from an Intensions Consulting study conducted between January 20, 2020, and January 28, 2020. For this study a 20-minute online survey was administered with a sample of 2,025 United States residents aged 16 years and older. The sample was stratified by gender, age, and region, to ensure that the sample’s composition reflected the underlying distribution of the population as determined by Census data. A traditional probability sample of comparable size would have produced results considered accurate to within plus or minus 2.2 percentage points, 19 times out of 20.
For more information on this research, please contact: info@intensions.co
REFERENCES
- Zhang, J., & Yu, K. F. (1998). What's the Relative Risk? A Method of Correcting the Odds Ratio in Cohort Studies of Common Outcomes. JAMA, 280(19), 1690-1691. DOI: 10.1001/jama.280.19.1690